Release 1.12.3 build 151 added post processing "Slice Plot" option


|
I am very pleased to see the new "Slice Plot" option on the "Post" menu that allows 2D plots on slices through 3D model solutions. For me it is a significant added capability. I have started experimenting with it and would like to make a few comments and ask a few questions. I have numbered them for clarity. The order does not represent relative importance or any other logical progression. It's just an order. Specific questions are in bold face.
[BTW, out of sheer laziness, I will not always be placing menu and other appropriate items in "quotes". I hope the meaning is clear.] 1. When the "Slice Plot" is generated the 3D plot space is used to show the location of the slice. Very helpful. 2. The Plots available are any combination of Surface, Arrow, Deformation, and the new Streamline plots. Iso Linear Contours are also now available and in my estimation represent a significant additional analytical view, since, unlike the Surface Plot, the Iso Contour was/is not available on the 3D Slice Plots. 3. The Slice Plot specification form and the resultant plot window have the same name. The axes are not labeled. Could these be changed? 4. The plot title, at least at times, seems to be formed by appending any existing 3D slice plot title to the selected "Slice Plot" option. Is this what is intended? 5. On one example (below) there is a stray geometry line in the plot. This line appears in the 3D plot space also. Perhaps it is a flaw in my geometry. 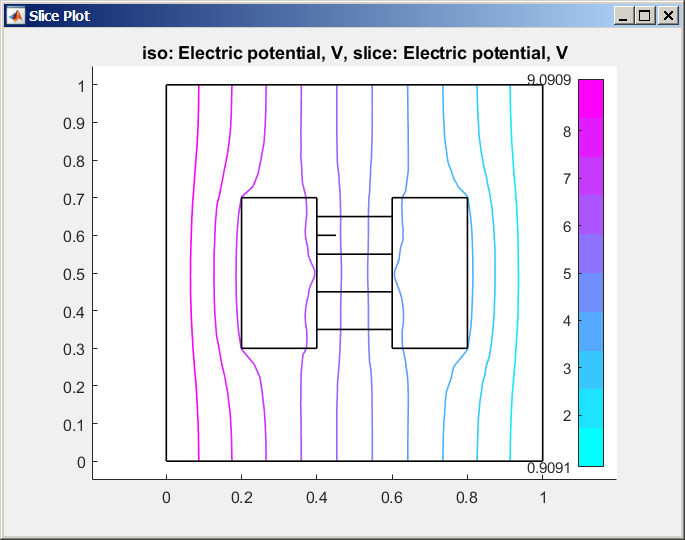 Here is the .fea file. cylinders_between_cylinders_in_boxv1-b151.fea My mistake? 6. Below are two Slice Plots. One with and one without the L2 projection gradient recovery that can be selected in the pop-out activated by the Post-->Postprocessing Settngs: 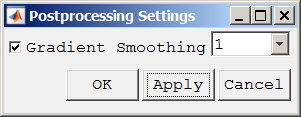 The problem I am using for this post has first order FEM Discretization set in Equation Settings. First order L2 Gradient Recovery is also set here in the Gradient Smoothing option above. No Smoothing: 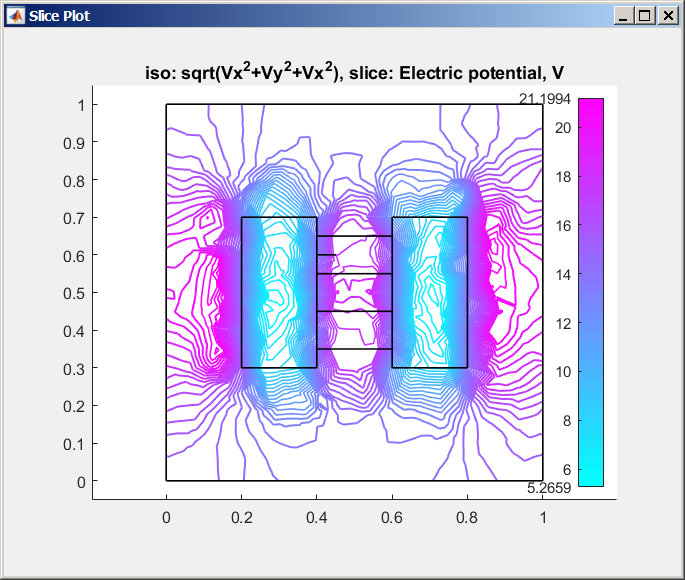 With Smoothing: 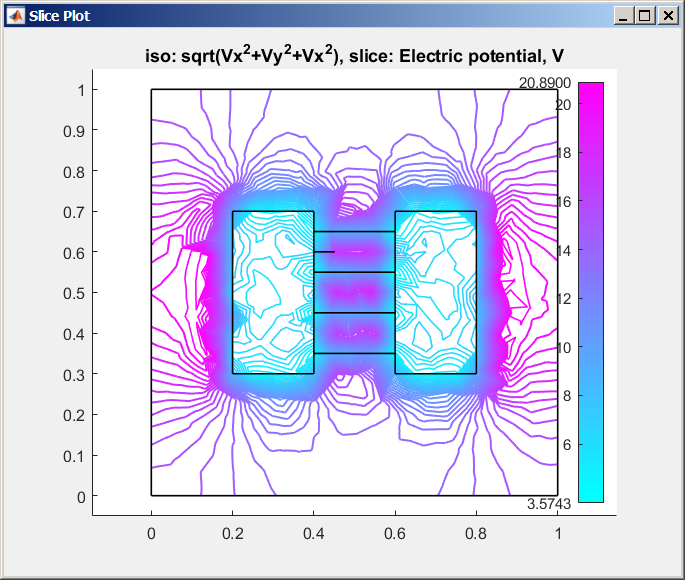 The additional smoothness of the second plot is clearly seen. 7. Unlike the surface plot, the Iso Contour plot does not have a "Range" field that could be use to select the range of values to be plotted. Could this be added? 8. On the Slice Plot selection screen, the Surface Plot setting seems to persist between closing and opening the screen. Yet, on the Iso Contour plot the expression to be plotted, the number of Contour levels, and the Colormap settings return to default. I would expect that this can be changed in a future release. 9. Finally, there are a few item that might be helpful if added to the Slice Plot window itself (the window that contains the actual plot): a) the ability to zoom in and out , b) to pan (slide the plot within the plot window) c) to hover over points plotted (or lines plotted) to see the coordinates and the value represented by the point (or line). Can any of these be added in a future release? As I said earlier, I believe this is a significant addition to FEATool capabilities. Thanks to "Precise Simulation" for making it available. Kind regards, -Randal |
Re: Release 1.12.3 build 151 added post processing "Slice Plot" option
|
Administrator
|
Thanks for the feedback, please find my comments below:
You can manually change it by first clicking on the slice plot figure (so that it is selected/active) and execute the command:
set( gcf, 'Name', 'My_Figure_Label' ) % gcf ~ get current figure handle
I'm not sure it would be meaningful as general slice with a normal not corresponding to an axis direction will result in a local coordinate system, and labeling as "x/y" would then probably be confusing (as it has nothing to do with the "real" x/y axes). You can of course manually add labels if you should like with the Matlab "xlabel" and "ylabel" commands. That is a bug from reusing the plot options, thanks. See my previous answers on this issue. I have not felt this was particularly necessary as you can manually specify contour levels as an expression that evaluates to a vector like ( "[0, 0.1, 0.3, 0.4, 1.0]", "0:0.1:0.5", or "linspace/logspace(0,0.5,5)" ). As it probably expected the slice plot dialog box just is a "clone" of the main plot dialog box, and inherits the settings from it but does not save its own settings (if you enable and define and arrow plot in the main postprocessing settings dialog box it will show up in the slice dialog box as well, but not vice versa). Yes, this is a good idea. By default I typically disable all toolbars for figures for a cleaner look. You can manually enable them again by first clicking on the slice plot figure (so that it is selected/active) and execute the command:
set( gcf, 'Toolbar', 'figure' )
|
|
|
Thanks. This works fine. Normally this would not be a problem, but with the small screen I am dealing with (laptop) I cannot move the Slice Plot settings window out to vacant real estate, so it goes hidden behind all the rest of the world. To find it I have to hover the mouse over the MATLAB icon in the Windows taskbar to see all the MATLAB windows ... and I see two that have the same name "Slice Plot" ... so I have to guess which is the one I want ... and I suppose I am about 50%. Ahh... I didn't think of that... I agree. I can add them if mine are orthogonal. I agree. This is not the first time that my unfamiliarity with MATABese encourages me to seek a more conventional solution. I need to drill this one (vector creation tricks) into my brain! Ok. That helps. I am having a bit of an issue with this one ... the added Toolbar is absent the +/-, pan, and rotate buttons that appear on the other postprocessing plots. However, when I add the MenuBar also, ... >> set( gcf, 'Name', 'The Slice Plot Figure', 'ToolBar', 'figure', 'MenuBar', 'figure' )...the Tools menu provides these, which is quite suitable. 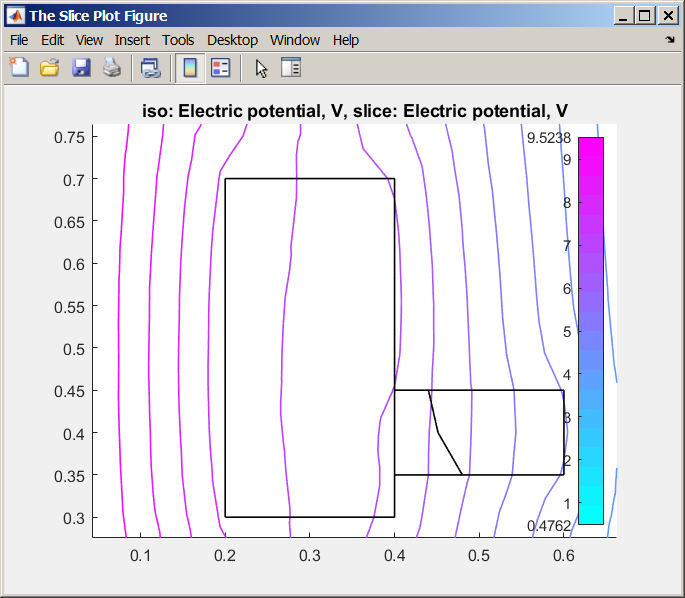 Thanks and kind regards, Randal |
|
|
In reply to this post by Precise Simulation
**** Build 157 Update ****
Nice job fixing and enhancing the "Slice Plot" capability. Let's see how many I can spot: Corrected with naming of "Slice Plot Settings". Bug corrected. Evidently corrected. See forum post under "Technical Issues", "v_merge Error and unexpected line in model" Something seems to be different here as well. I am seeing some persistence. Is this feature added as well? All done! .... except for possibly the last part of c) "and the value". I'm having trouble getting the value to be displayed even though replacing/modifying the datatip function 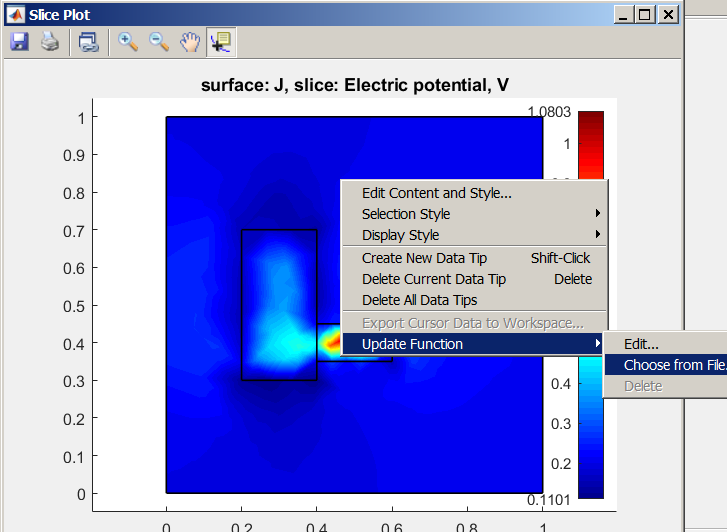 with: userdatatip.m ...but I can't find the UserData... get(event_obj.Target, 'UserData' ), ... % nothing returnd for UserData HOWEVER, I see that it IS output to the FEATool Command Log window: Expression __var_1 at (0.6674,0.7086) = 0.215337 Nice Job! What have I missed? -Randal |
Re: Release 1.12.3 build 151 added post processing "Slice Plot" option
|
Administrator
|
It is to my knowledge only possible to use the datatip hover functionality for pure contour/line plots, if you have/add surface plots this will not be possible. If you want to pursue this I would suggest you check with the Mathworks if they know a way to make it possible. The "UserData" field is only set for the contour line plot objects and otherwise not used and therefore empty. The 2D surface plot sets a "ButtonDownFcn" callback on the corresponding patch graphics objects to evaluate the currently plotted function at the clicked point (by using the evalexpr function). |
|
|
That explains it. I was only plotting "surface". If I slice plot only Iso: 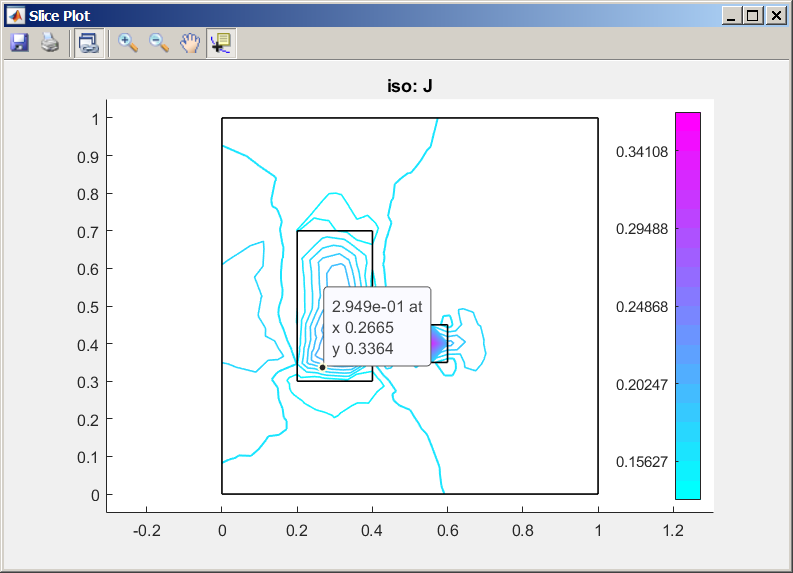 ...or Iso and Surface: 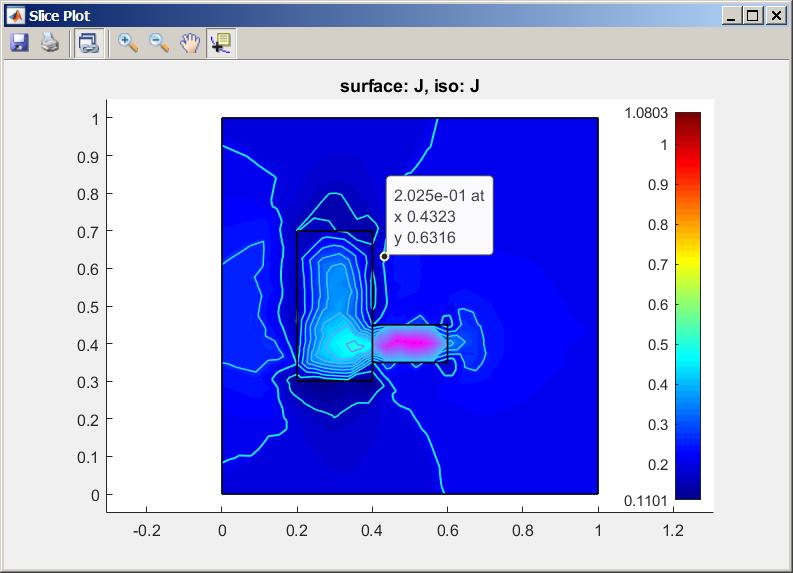 I am able to use my datatip function that displays "UserData"! Now I am faced with a question about the colorbar: When both Iso & Surface are plotted, does the color bar apply to the Iso/contour plot or to the Surface plot? Kind regards, Randal |
Re: Release 1.12.3 build 151 added post processing "Slice Plot" option
|
Administrator
|
There is to my knowledge no easy way of having multiple colorbars in a Matlab figure axis so iso/contour plot colorbars are only shown if that is the only plot option that is selected. |
«
Return to Basic Use
|
1 view|%1 views
| Free forum by Nabble | Edit this page |