There are two difficulties I have encountered with subdomain and Boundary visibility - the ability to identify visually the subdomain our boundary on a plot that is identified by a number in the GUI.
The first is in the Grid Mode after I have created a geometry for which I wish to specify the grid sizes by subdomain and/or boundary.
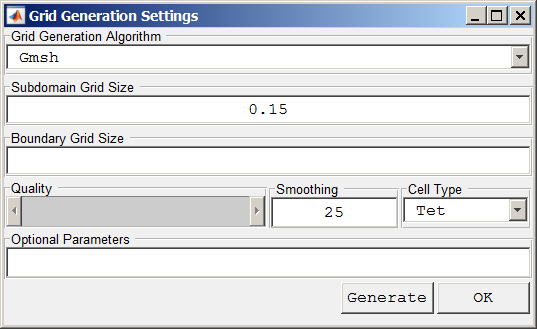
I guess the Subdomains and Boundaries are created by the mesh process itself and so the specifications of the grid sizes at the subdomain and boundary level could not be done definitively until after the first grid generation, but perhaps there is a way to know or anticipate (possibly with less than 100% accuracy) how this numbering will go.
I have found that sometimes if I accept the default grid spacing and create the grid that I can view the subdomains from the Equation Settings and the boundaries from the Boundary Settings windows - but not always (see second issue below). However, I am concerned that there would be times when the default value might fail, and require a very small value that may take a very long time to generate (or fail generation) if used for all subdomains. I would like to be able to designate the grid size for those domains/surfaces up front so as to not make tight grids where they are not needed (for my Electric Shock Drowning use-case this might in open water, far from persons or objects of interest), but provide them explicitly where they are needed (like in the vicinity of a person or object in the water).
Possibly there is a Matlab construct that could be placed in these windows that would be processed and create the appropriate grids.
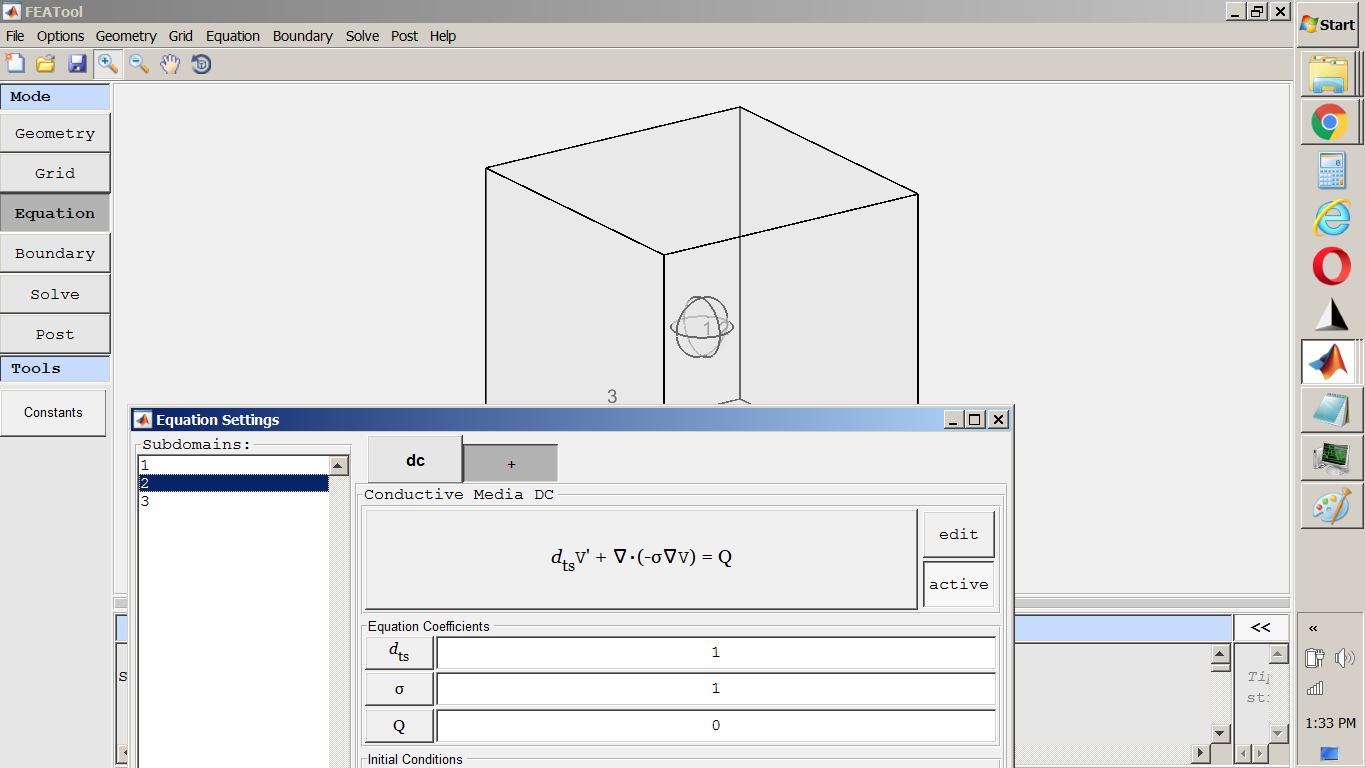
The second problem is more subtle. The problem in this file illustrates it:
concentricSpheresInBox.feaThe model consists of concentric spheres 1mm and 100m enclosed by a 1x1x1m box. In the Equation Settings window, selecting #3 displays the box clearly by highlighting it on the plot, but selecting #1 or #2 (the spheres) produces no identifiable indication. I realize that the huge difference in sizes fo the spheres (100:1) would make the smaller sphere nearly impossible to view while the larger one was entirely visible (supposedly zooming in would reveal it when selected*), but even the larger sphere fails to highlight when selected.
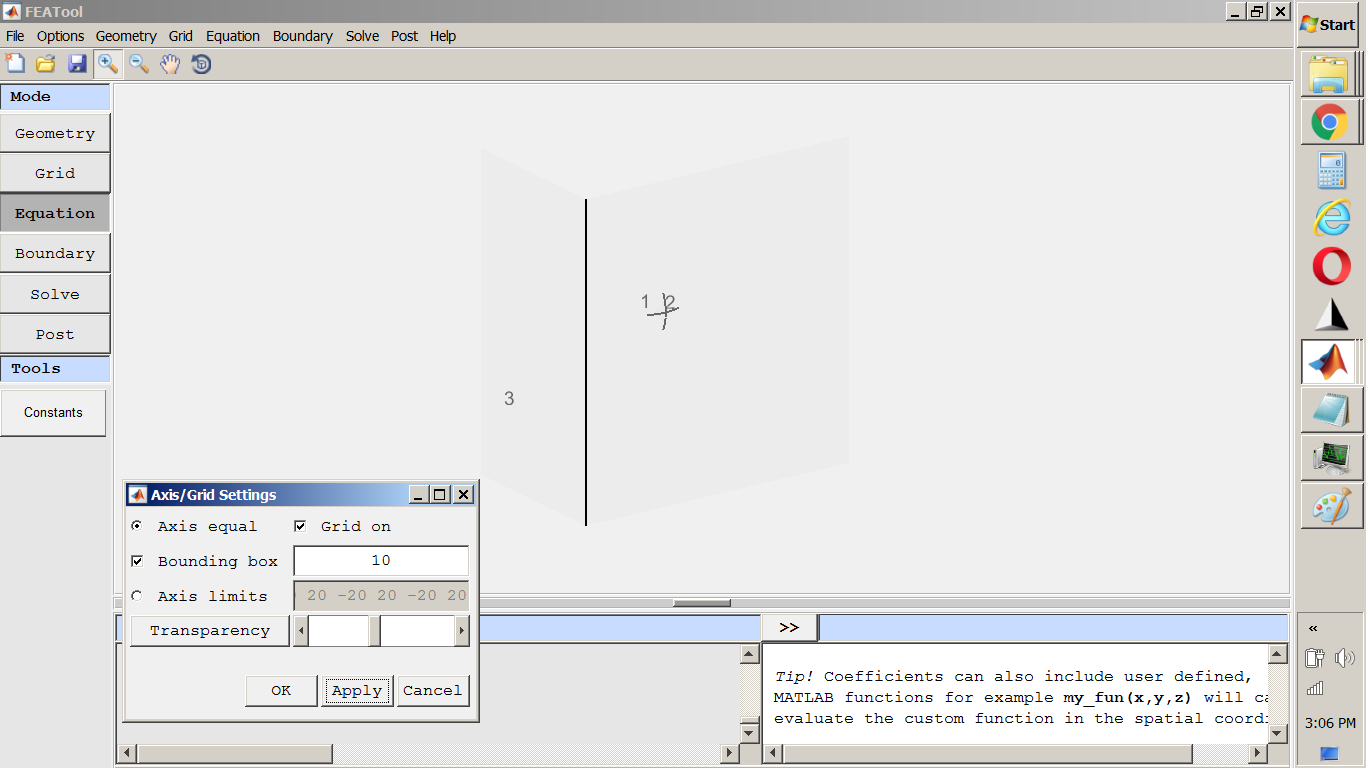
*Zooming does not seem to help (on this example). As I zoom in, I start loosing parts of the objects. I have tried using the Axis/Grid Settings window to solve this issue but to no avail. What I am trying to do is to zoom in to see the smaller sphere.
As always any and all forms of help are greatly appreciated!
Kind regards,
Randal

