Heat Conduction with Tabulated Thermal Conductivity
Posted by

 Precise Simulation
–
Precise Simulation
–
Precise Simulation
–

A recent FEATool Multiphysics heat conduction tutorial example illustrates how to use data from a (text) file in an equation coefficient. The tabulated data here represents non-linear thermal conductivity as a function of temperature k = f(T). Where the conductivity curve is given as sin(pi/8) to sin(3/4*pi) for temperature values between 280 to 400. In the data (text) file the first column represents temperature values and second the coefficient value:
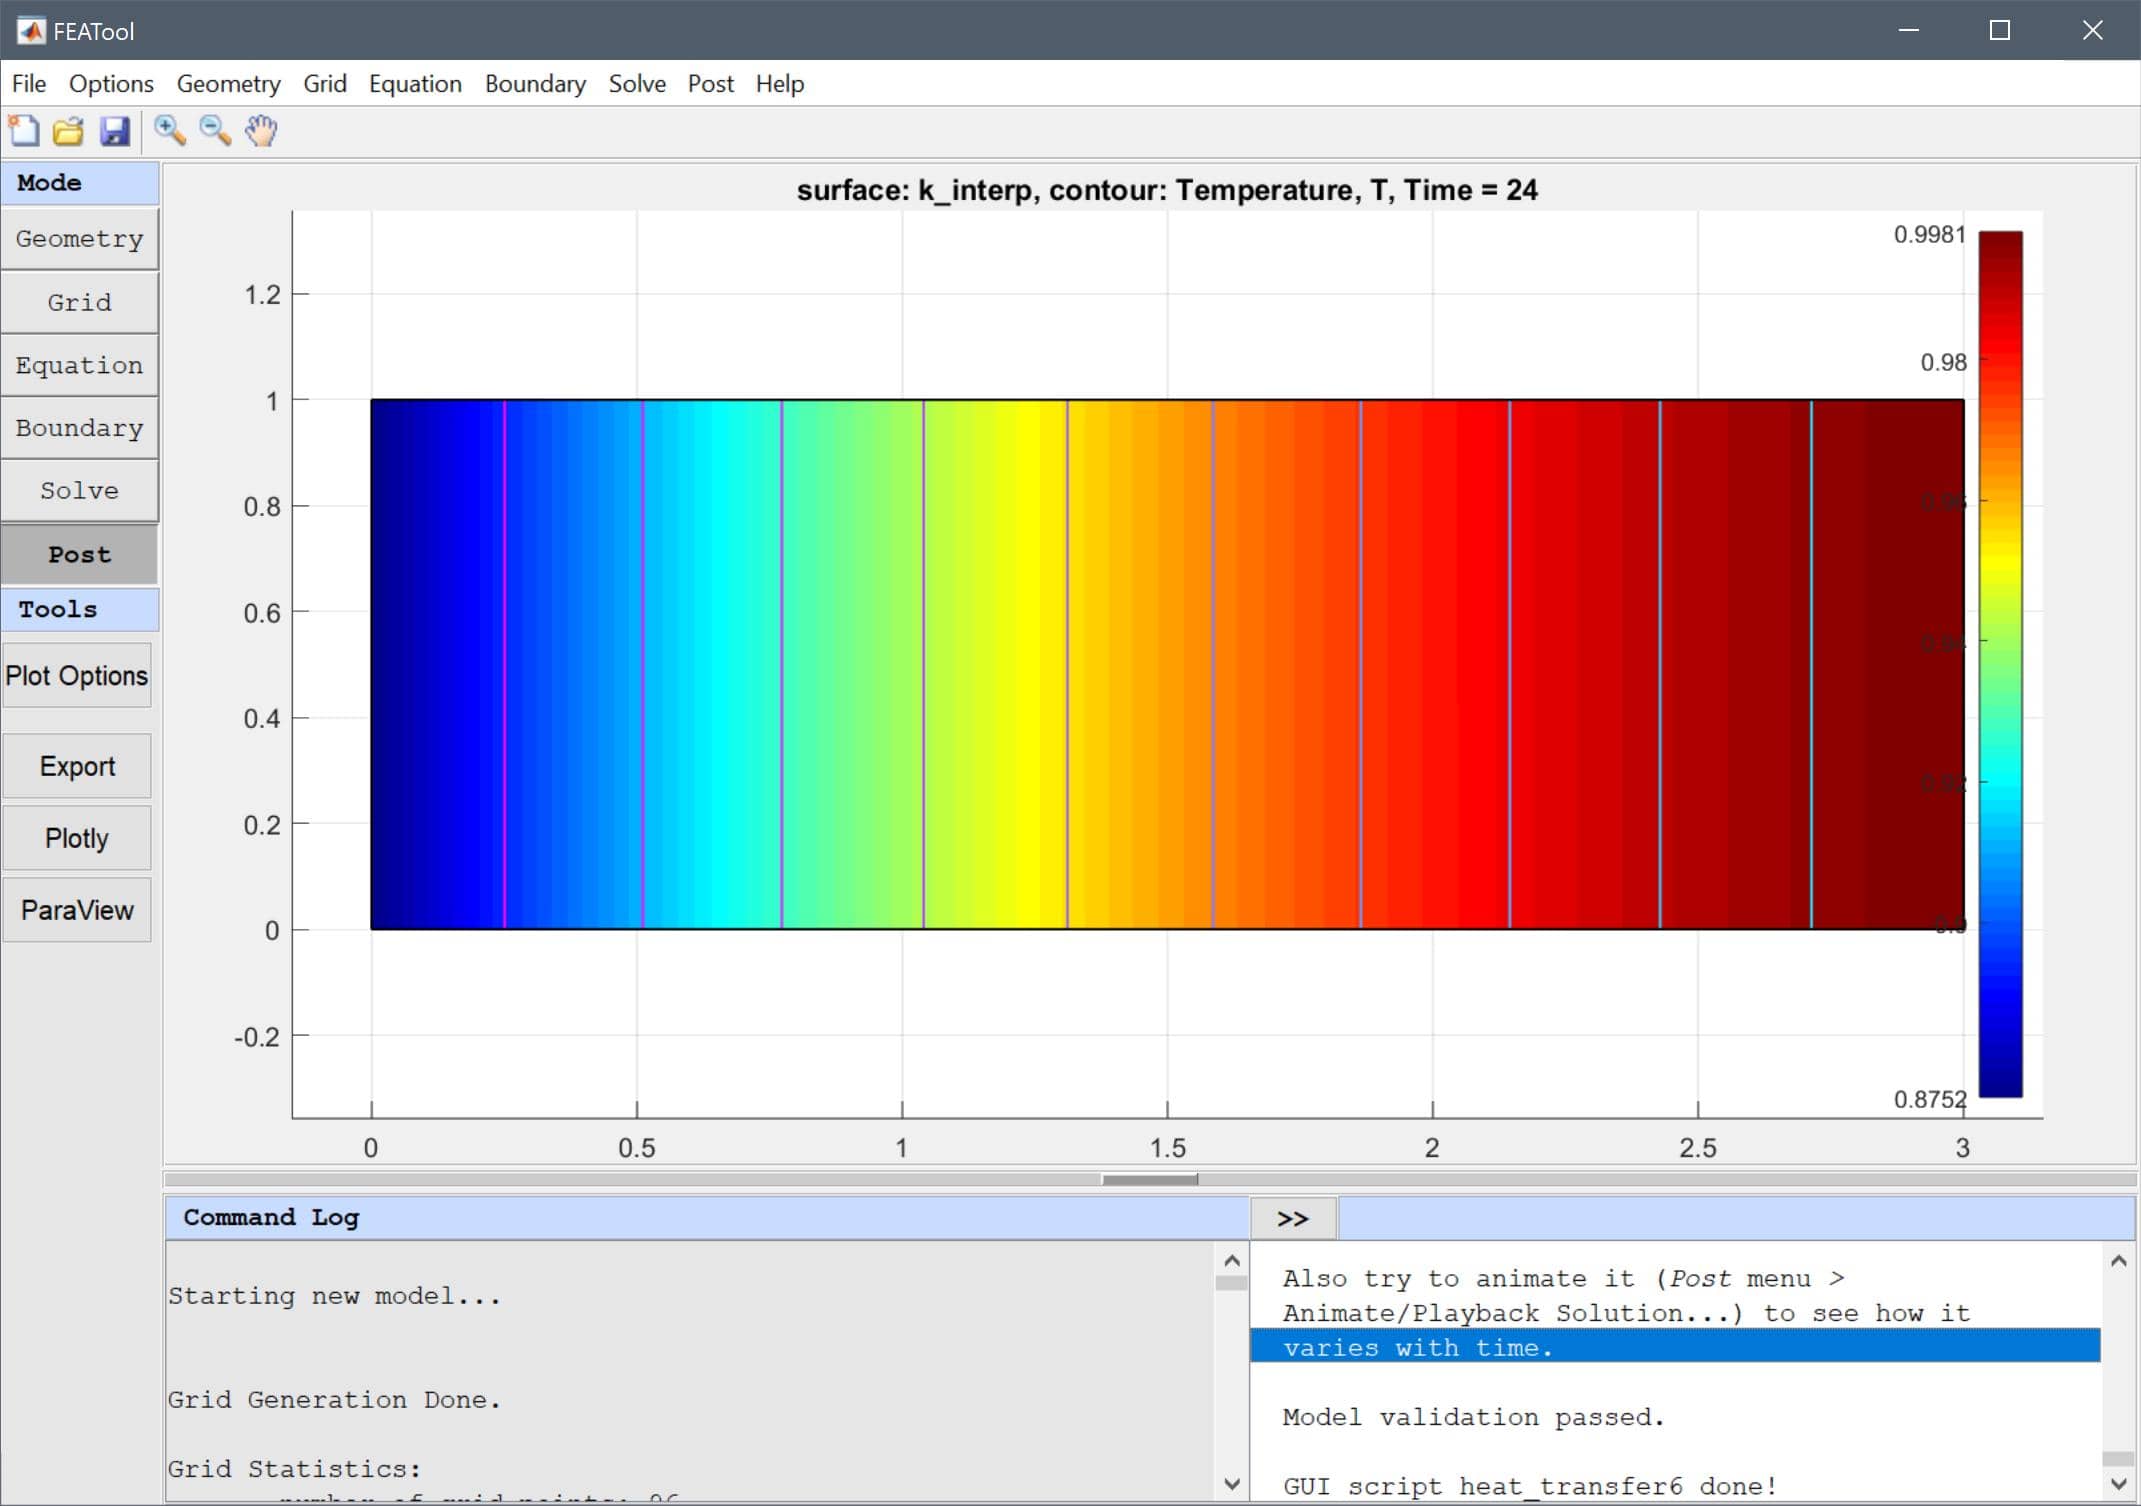
The coefficient is implemented and called from the toolbox using the finterpn function, which also supports interpolation in higher n dimensions (as well as .csv and .mat file formats).
The model is available as an automated tutorial by selecting Model Examples and Tutorials > Heat Transfer > Heat Conduction with Tabulated Thermal Conductivity from the File menu in the toolbox GUI. Or alternatively, follow the linked step-by-step tutorial instructions.
    280.0000 0.3827
    281.2121 0.4009
    ...
    398.7879 0.7210
    400.0000 0.7071
The coefficient is implemented and called from the toolbox using the finterpn function, which also supports interpolation in higher n dimensions (as well as .csv and .mat file formats).
The model is available as an automated tutorial by selecting Model Examples and Tutorials > Heat Transfer > Heat Conduction with Tabulated Thermal Conductivity from the File menu in the toolbox GUI. Or alternatively, follow the linked step-by-step tutorial instructions.

| Free forum by Nabble | Edit this page |