evaluation of the diffusion term at each grid point

Previous Topic Next Topic
 
classic Classic list List threaded Threaded
4 messages Options
Reply | Threaded
Open this post in threaded view
|

evaluation of the diffusion term at each grid point

James
Hi

For the example of export data to csv file https://www.featool.com/doc/post#postex, would it be possible to evaluate the diffusion term d_cd*(cx_x + cy_y) at each grid point for the convection and diffusion module?

It seems the cx and cy are saved in fea, but cx_x and cy_y are not saved?

Thanks!
Reply | Threaded
Open this post in threaded view
|

Re: evaluation of the diffusion term at each grid point

Precise Simulation
Administrator
The "_xi" underscore syntax is only used for equation specification (indicating terms to use partial integration in the FEA discretization) and *can not* be used for postprocessing. Technically it is possible to reconstruct 2nd order derivatives using the gradient_recovery function as for example here (however accuracy might be an issue, especially at boundaries):

    i_dvar  = 1;   % Dependent variable to differentiate.
    j_deriv = 2;   % Derivative component 2=x, 3=y, 4=z.
    ux = gradient_recovery(fea, i_dvar, j_deriv, fea.sol.u(:,end));
    uxx = gradient_recovery(fea, i_dvar, j_deriv, ux);
    
    % Add custom variable for uxx.
    fea.vars = struct('name', 'uxx', 'data', uxx);
    
    postplot(fea, 'surfexpr', 'uxx')

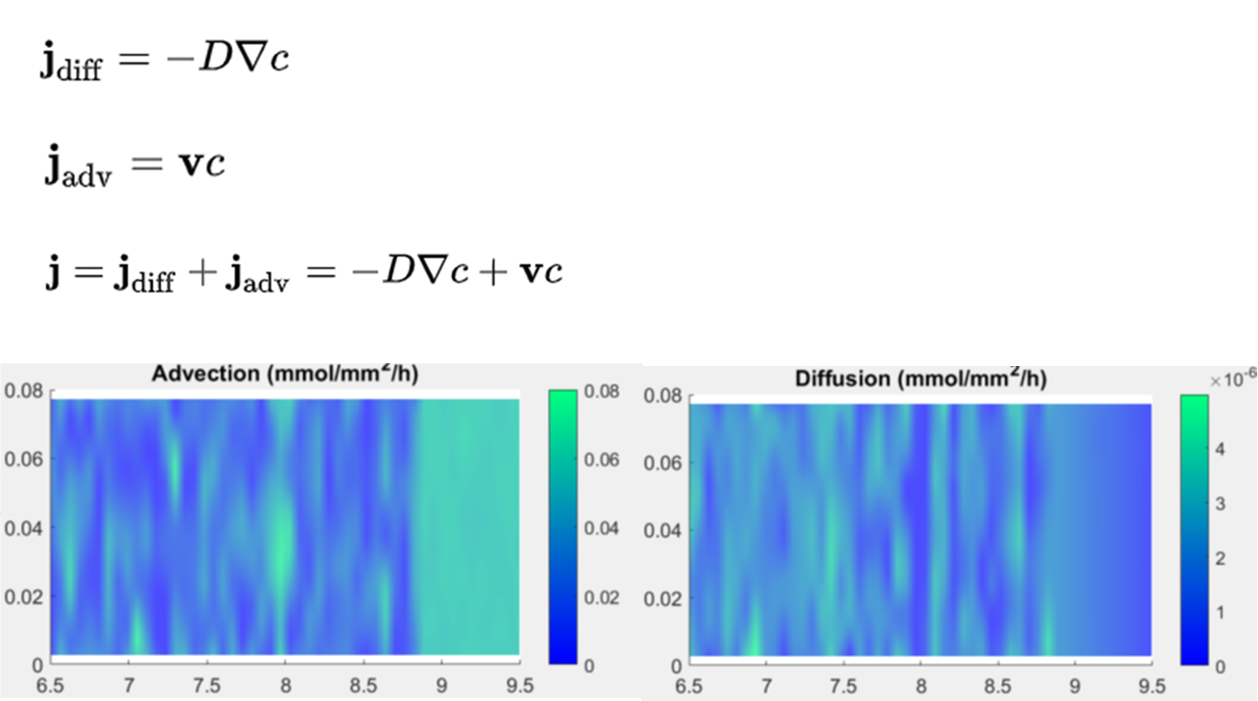
Note, that the diffusive flux over the domain does not genrally include second order derivatives as it would be defined as "-d_cd*(cx + cy)" [mol/m^2/s].
Reply | Threaded
Open this post in threaded view
|

Re: evaluation of the diffusion term at each grid point

James
thanks for your suggestion.

Would it be possible to evaluate the contribution of the advection and diffusion at each grid point (see figure below). I tried to extract the cx, cy, c, u and v at each grid point. However, if I used the formula below to calculate the Jdiff and Jadv and then generate the surface plot, I got some patterns that are hard to explain. I used griddata(x,y,z,X,Y,'v4') and then surface to generate these surface maps. Are there numerical issues in these calculations based on datasets extracted from Featool?

which function did Featool use to generate the surface map? Would it be possible to get diffusion and advection distributions directly from Featool?

Reply | Threaded
Open this post in threaded view
|

Re: evaluation of the diffusion term at each grid point

Precise Simulation
Administrator
This post was updated on .
The total (diffusive + convective) flux is in general defined as "-d_cd*(cx+cy)+(u_cd+v_cd)*c" for a typical 2D convection diffusion physics mode, and can be plotted just by enterin this expression in the GUI, or using the "postplot" function, or evaluated in grid (or general) point using the "evalexpr" function (which is essentially what the postplot function uses).

Hard to give specific advice with the information provided, could you include the actual code/functions to generate the plot?